Lean UX Design: the key to revolutionizing your BI development
What is Lean UX Design and why is it crucial to your BI?
In the dynamic world of Business Intelligence (BI), where the complexity of data meets the evolving needs of users, Lean UX Design is emerging as a revolutionary approach. This user-centered methodology promises to radically transform the way we design and develop BI solutions.
Lean UX design in brief
- User-centered approach
- Rapid iterations and continuous feedback
- Cross-functional collaboration
- Waste reduction and resource optimization
- Agile adaptation to change
But how can Lean UX concretely improve your BI projects? Let’s delve into the details.
The 5 key steps of the Lean UX process in BI
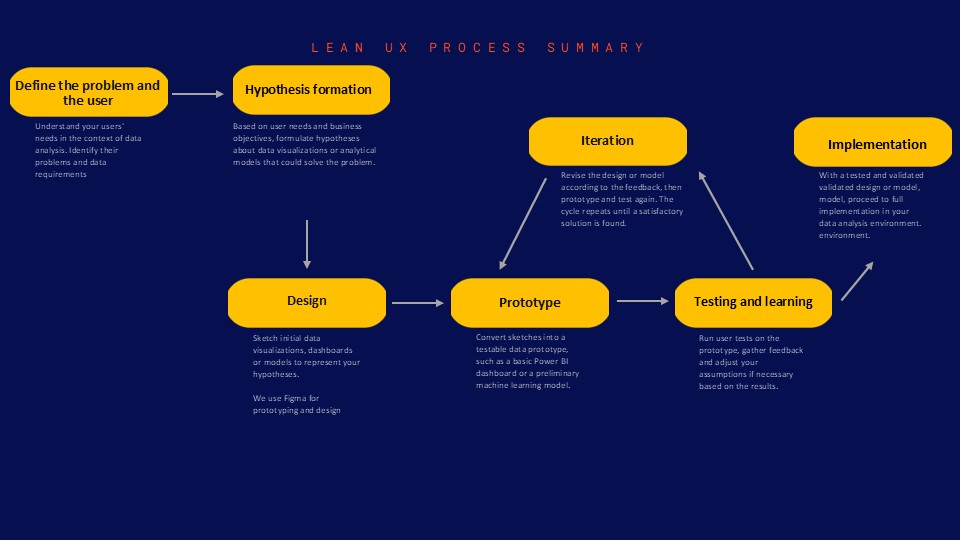
- Problem and user definition: gain an in-depth understanding of your BI users’ specific challenges.
- Ideation and hypotheses: formulate hypotheses about potential solutions.
- Rapid prototyping: create low-fidelity prototypes to test your ideas.
- User testing: get rapid feedback to validate or invalidate your hypotheses.
The tangible benefits of Lean UX in BI development
1. Significant reduction in development time and costs
By quickly identifying what works and what doesn’t, Lean UX saves precious resources.
“Thanks to DATANALYSIS’ Lean UX approach, we reduced our BI development costs by 30% while increasing user satisfaction by 50%.”
– Marie Dupont, CIO, TechInnovate SA
2. Improved user experience and adoption of BI tools
BI solutions designed with users, for users, guarantee better adoption and use.
3. Greater agility and adaptability to market changes
In an ever-changing BI environment, Lean UX enables you to pivot quickly and efficiently.
Here are the 5 steps to implementing Lean UX in your BI projects :
Integrating Lean UX into your BI strategy: where to start?
Adopting Lean UX in your BI development can seem daunting.
Here are some steps to get you started:
- Assess your current UX maturity
- Train your teams in Lean UX principles
- Start with a pilot project
- Measure and communicate results
- Gradually extend the approach to other projects
CONCLUSION
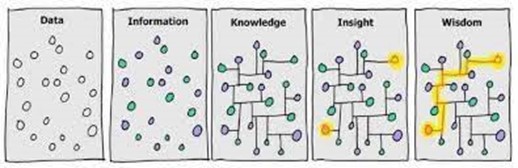
In a world where data is king, Lean UX offers a way to turn that data into actionable insights faster and more accurately than ever before. For companies looking to make the most of their BI investments, Lean UX isn’t just an option, it’s a competitive necessity.
At BUSINESS LAB CONSULTING, we’re passionate about applying Lean UX to BI development. Our team of experts is ready to guide you through this transformation to optimize your processes, reduce your costs and significantly improve the user experience of your BI solutions.