Let’s start by defining what epistemology is.
Epistemology (from the ancient Greek ἐπιστήμη / epistémê “true knowledge, science” and λόγος / lógos “discourse”) is a field of philosophy that can refer to two fields of study: the critical study of science and of scientific knowledge (or scientific work).
In other words, it’s about how we construct our knowledge.
In the world of data, this is a central and critical topic. We are familiar with the process of transforming data into information, knowledge and wisdom:

Here, the problem lies in the way we consider our starting point: data! Indeed, the use of data and its transformation in the following stages are the result of conscious and controlled processes and procedures:
==>I clean up my data, process it in an ETL / ELT, store it, visualize it, communicate my results and share them, and so on. This mastery gives us control over the quality of each step. However, we tend to embark on this work of transforming our primary resource while overlooking a crucial point, the source of our first obstacle:
DATA IS NOT AN EXACT REPRESENTATION OF THE REAL WORLD!
Indeed, it’s all too easy to work with data by thinking of data as reality itself, and not as data collected about reality. This nuance is essential:
It’s not crime, but reported crime
It’s not the diameter of a mechanical part, but the measured diameter of that part.
It’s not public sentiment on a subject, but the declared feeling of those who responded to a survey.
Let’s go into the details of this obstacle with a few examples:
1. What we don't measure (or didn't measure)
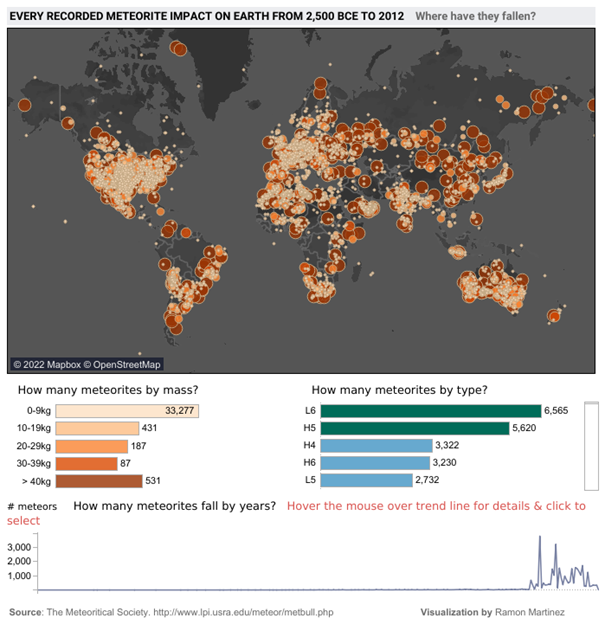
Let’s take a look at this dashboard showing all the meteorite impacts on Earth between -2500 and 2012. Can you identify what’s strange here?

Meteorites seem to have carefully avoided certain parts of the planet – a large part of South America, Africa, Russia, Greenland, etc. And if we focus on the graph showing the number of meteorites per year, these have tended to fall more in the last 50 years (and almost not over the whole period covering -2055 to 1975).
Is this really the case? Or rather flaws in the way the data was collected?
- We have recently begun to systematically collect this information and rely on archaeology to try and determine the impacts of the past. As erosion and time have taken their toll, the traces of the vast majority of impacts have disappeared and can no longer be counted (and no, meteorites didn’t start raining in 1975).
- For a meteorite impact to be included in a database, it has to be recorded. And to do that, you need an observation, and therefore an observer, who knows who to report it to. These two biases have a major impact on data collection, and help to explain the large areas of the Earth that seem to have been spared by the meteorite fall.
2. Measurement system not working
Sometimes, the cause of this discrepancy between data and reality can be explained by a defect in the collection equipment. Unfortunately, anything manufactured by a human being in this world is liable to fail. This applies to sensors and measuring instruments, of course.
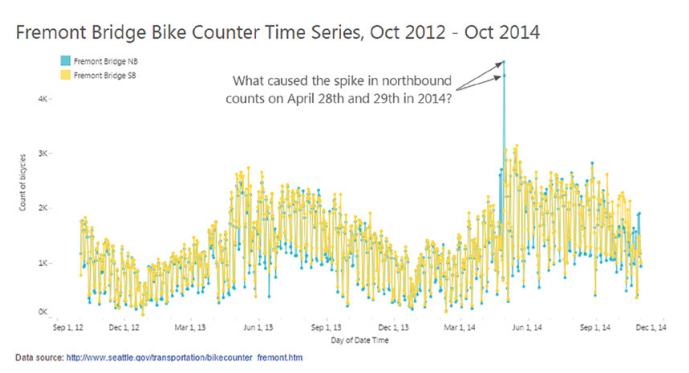
What happened on April 28 and 29, 2014 on this bridge? There seems to have been a huge spike in bicycle traffic across the Fremont Bridge, but only in one direction (blue curve).

Source : 7 datapitfalls – Ben Jones
Time series of the number of bicycles crossing the Fremont Bridge
You’d think it was a beautiful summer’s day and everyone was on the bridge at the same time? That it was a one-way bike race? That everyone who crossed the bridge on the outward journey had a flat tire on the return journey?
More prosaically, it turns out that the blue counter had a fault on those particular days and was no longer counting bridge crossings correctly. A simple change of battery and sensor solved the problem.
Now, ask yourself how many times you’ve been misled by data from a faulty sensor or measurement without being aware of it?
3. Data is too human
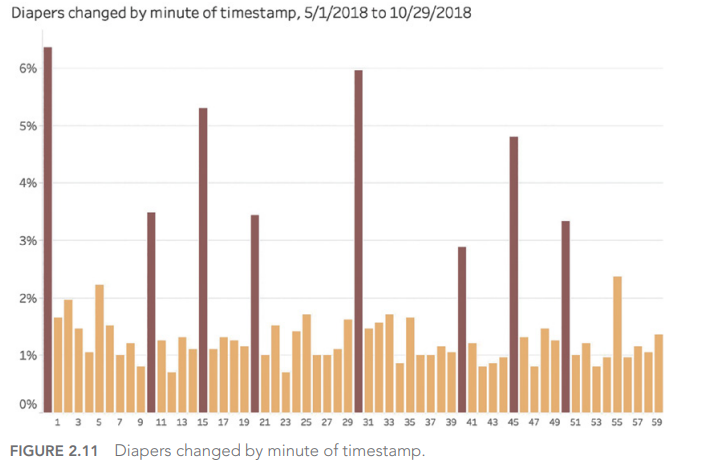
And yes, our own human biases have a major effect on the values we record when gathering information. We tend, for example, to round off measurement results:

Source : 7 datapitfalls – Ben Jones
If we go by his data, diaper changes take place more regularly every 10 minutes (0, 10, 20, 30, 40, 50) and sometimes over certain quarters of an hour (15, 45). Wouldn’t that be incredible?
It is an incredible story. In fact, we need to look at how the data was collected. As human beings, we have this tendency to round up information when we record it, especially when we look at a watch or clock: why not indicate 1:05 when it’s 1:04? Or even simpler, 1:00, because it’s even simpler?
4. The Black Swan!
The final example we’d like to highlight here is the so-called “Black Swan” effect. If we think that the data we have at our disposal is an accurate representation of the world around us, and that we can extract from it assertions to be set in stone; then we are fundamentally mistaken about what data is (see above).
The best use of data is to learn what isn’t true from a preconceived idea, and to guide us in the questions we need to ask ourselves to learn more?
But back to our black swan:
Before the discovery of Australia, every swan sighting ever made could confirm to Europeans that all swans were white – wrong! In 1697, the sighting of a black swan completely challenged this common preconception.
And the link with the data? In the same way that we tend to believe that a repeated observation is a general truth – wrongly so – we can be led to infer that what we see in the data we manipulate can be applied generally to the world around us and to any era. This is a fundamental error in the appreciation of data.

5. How to avoid epistemological error?
All it takes is a little mental gymnastics and a little curiosity:
- Clearly understand how measurements are defined
- Understand and represent the data collection process
- Identify possible limitations and measurement errors in the data used
- Identify changes in measurement methods and tools over time
- Understand the motivations of data collectors
In the next article, we’ll explore the 2nd type of obstacle we may encounter when using data to illuminate the world around us: Technical Mistakes.
This article is heavily inspired by the book “Avoiding Data pitfalls – How to steer clear of common blunders when working with Data and presenting Analysis and visualization” written by Ben Jones, Founder and CEO of Data Litercy, WILEY edition. We recommend this excellent read!
You can find all the topics covered in this series here : https://www.businesslab.mu/blog/artificial-intelligence/data-7-pitfalls-to-avoid-the-introduction/
