Having defined a few key data-related concepts, we can now delve into the technical issues that can lead to errors. This article deals with the problems associated with the process of obtaining the data that will subsequently be used. It’s about building the foundations of our analyses.
And it goes without saying that we don’t want to build a house of cards on sand!
To stay with the construction metaphor, if problems of this nature exist, they will be hidden and barely visible in the final building. Particular care must therefore be taken during the data collection, processing and cleaning stages. It’s not for nothing that it’s estimated that 80% of the time spent on a data science project is spent on this type of task.
To avoid falling into this trap, and to limit the load required to carry out these potentially tedious operations, we need to accept three fundamental principles:
- Virtually all datasets are not clean and need to be cleaned and formatted.
- Each transition (formatting, join, link, etc.) during the preparation stages is a potential source of new error
- It is possible to learn techniques to avoid the creation of errors arising from the first two principles.
Accepting these principles does not remove the obligation to go through this preliminary work before any analysis, but the good news is that knowing how to identify these risks, and learning as we go along, helps to limit the scope of this second obstacle.
1. The trap of dirty data.
Data is dirty. I’d even go so far as to say that all data is dirty (see first principle above), with problems of formatting, data entry, inconsistent units, NULL values and so on.
Some well-known examples of this trap
Take the crash of NASA’s Mars Climate Orbiter in 1999, for example. A $125 million error caused by a dual unit system: imperial and metric units. This led to an erroneous calculation that affected the power sent to the probe’s thrusters and its destruction.
Fortunately, not all errors of this nature will cost us so much money! But they do have a significant impact on the results and ROI of the analyses we carry out.
So, at DATANALYSIS, we’re currently running several projects specifically on data quality in the context of DATA Marketing, and we’re dealing with two types of subject:
- Data validation, which aims to improve data quality through data processing, by :
-Standardizing fields (phone number, email, etc.): +262 692 00 11 22 / 00262692001122 / 06-92-00-11-22 correspond to the same line, and we can automate much of this work thanks to appropriate processing;
– Filling in empty fields using other data in the table. For example, we can deduce the country of residence from telephone numbers, zip codes, cities, etc.
- Deduplication, by :
-Using adapted rules to identify potentially identical lines. Two records with the same e-mail address, telephone number or company ID;
-Using distance calculation algorithms to define similar values in terms of spelling, pronunciation, common characters, etc.
From these examples and our own experience, we can see that this type of error mainly stems from data entry, collection or “scrapping” processes, whether implemented automatically or by humans. So, in addition to the solutions that can be implemented in data preparation processes, improving these preliminary steps will also greatly improve the quality of the data to be processed, and this requires education, training and the definition of rules and standards that are clearly known and shared (data governance is never far away).
Finally, we should also ask ourselves when we can consider this stage to be sufficiently clean. After all, we can always do more and better, but the costs involved can often outweigh the expected returns.
2. The data transformation trap
In the IT world, there’s an image that sums up this type of problem:
Often, the mistake lies between the screen and the seat!
And yes, even the best data scientists, data analysts or data engineers can make mistakes in the data cleansing, transformation and preparation stages.
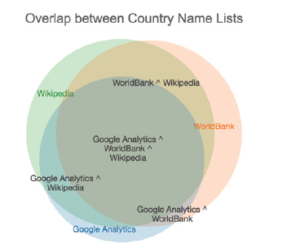
Frequently, we manipulate several files from different sources and different applications, which multiplies the risks associated with dirty data issues and the risks when manipulating the files themselves:
- Different levels of granularity
- Joins on fields whose values are not exactly identical (e.g. ST-DENIS vs SAINT DENIS).
- Different file perimeters

And this problem can also be made more complex depending on the tools used in our analyses:
- In Tableau, for example, we can perform data joins, relations or links to link several datasets together. Each type of operation has its own rules and constraints.
- In Qlik, you need to understand how the associative engine works and the associated modeling rules, which differ from those of a traditional BI model.
In this case, it’s often a question of technical constraints linked to the very business of data preparation, and taking the time to understand the risks and processes in place will save a great deal of time in delivering reliable, high-performance data analysis.
In the next article, we’ll explore the 3rd type of obstacle we may encounter when using data to shed light on the world around us: Mathematical errors.
This article was strongly inspired by the book “Avoiding Data pitfalls – How to steer clear of common blunders when working with Data and presenting Analysis and visualization” written by Ben Jones, Founder and CEO of Data Litercy, WILEY edition. We recommend this excellent read!
You can find all the topics covered in this series here : https://www.businesslab.mu/blog/artificial-intelligence/data-7-pitfalls-to-avoid-ep-1-7-epistemological-errors-how-do-we-think-about-data/
