Artificial Intelligence

Artificial Intelligence, Data Governance, Data Marketing, Data Mining and Data Integration, Data visualisation

DATA: 7 Pitfalls to Avoid, Ep 7/7 – Design dangers

The Critical Role of Design in Data Presentation

As Steve Jobs once said, « Design is not just what it looks like and feels like. Design is how it works. » This principle applies perfectly to data visualization. In this final episode of our series, we’ll explore the often-overlooked dangers related to design in data presentation.

Pitfall 7A: Confusing colors

Color choice is a crucial aspect of data visualization design, yet it’s often mishandled. Poorly chosen colors can make visualizations difficult to read or even misleading. Here are some common color-related pitfalls:

  1. Using too many colors: This can visually overwhelm and make understanding difficult.
  2. Choosing colors that don’t contrast well: This can make it challenging to differentiate between categories.
  3. Ignoring color blindness: Some color combinations can be indistinguishable for color-blind individuals.
  4. Using the same color for different variables: This can lead to confusion and misinterpretation.

Consider this example of a poorly designed dashboard:
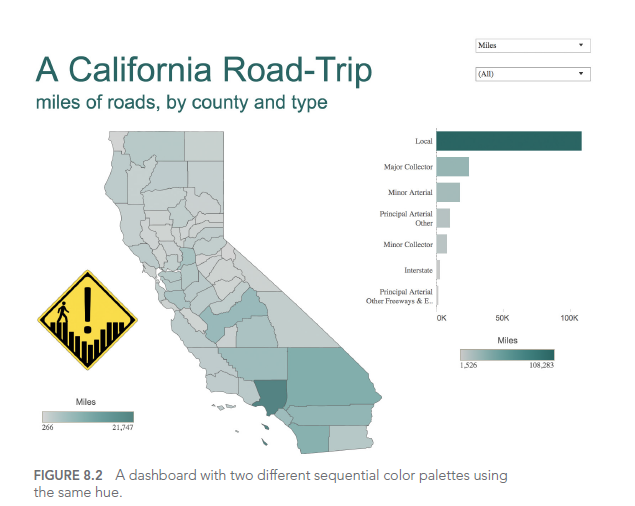
In this dashboard, the use of similar colors for different categories makes it difficult to distinguish between crime types. A better approach would be to use a clear, distinct color palette with high contrast between categories.

Pitfall 7B: Missed opportunities

Sometimes, in our quest for simplicity, we miss opportunities to enhance understanding through design. Thoughtful addition of visual elements can greatly improve engagement and memorability.

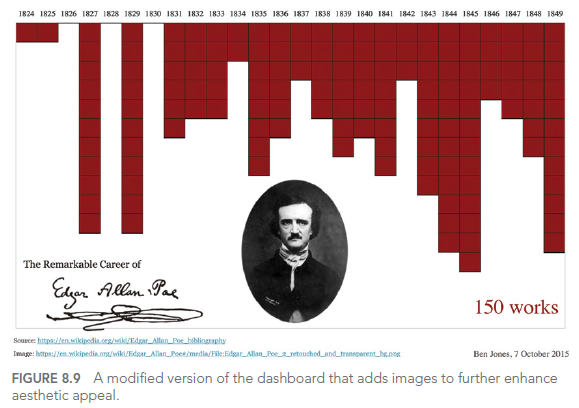
For example, consider this improved visualization of Edgar Allan Poe’s works:
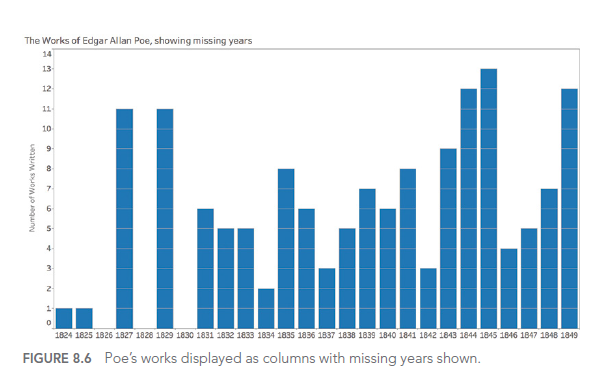
This visualization uses design elements to evoke the dark ambiance of Poe’s works, making the visualization more memorable and engaging. The inverted y-axis and blood-red color scheme add to the ominous feel, while the portrait and signature provide context and personality.

Pitfall 7C: Usability Uh-Ohs

Good design isn’t just about visual appeal; it must also consider usability. Visualizations that are difficult to manipulate or understand can frustrate users and limit the effectiveness of data communication.

Key usability considerations include:

  • Intuitive navigation: Users should easily understand how to interact with the visualization.
  • Clear labeling: All elements should be clearly labeled to avoid confusion.
  • Responsive design: Visualizations should work well on various devices and screen sizes.
  • Accessibility: Design should accommodate users with different abilities.

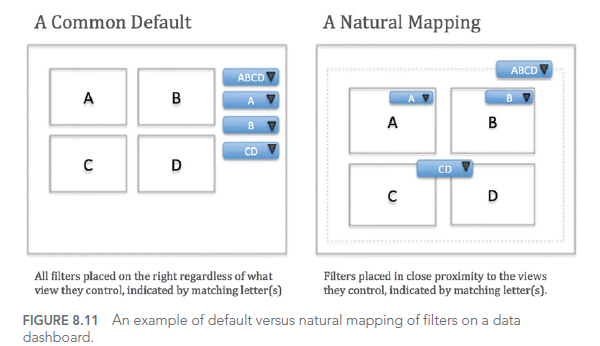
Here’s an example of a dashboard with potential usability issues:
While this dashboard offers numerous interaction options, without careful user interface design, it can become overwhelming and difficult to use effectively. A better approach would be to simplify the interface, prioritize key information, and provide clear guidance on how to interact with the visualization.

CONCLUSION

In this final article of our series, we’ve explored the seventh type of error we can encounter when working with data: design dangers. We’ve seen how color choices, missed opportunities, and usability issues can affect the effectiveness of our data visualizations.

Throughout this seven-part series, we’ve covered a wide range of common pitfalls in working with data, from how we think about data to how we present it. By being aware of these pitfalls and learning how to avoid them, we can significantly improve our ability to work effectively with data and communicate valuable insights.

Remember, good design in data visualization is not just about making things look pretty. It’s about enhancing understanding, facilitating insights, and enabling better decision-making. As you continue your data journey, keep these principles in mind to create visualizations that are not only visually appealing but also clear, informative, and user-friendly.

This series of articles is strongly inspired by the book « Avoiding Data Pitfalls – How to Steer Clear of Common Blunders When Working with Data and Presenting Analysis and Visualizations » written by Ben Jones, Founder and CEO of Data Literacy, WILEY edition. We highly recommend this excellent read to deepen your understanding of data-related pitfalls and how to avoid them!

You can find all the topics covered in this series here: https://www.businesslab.mu/blog/artificial-intelligence/data-7-pitfalls-to-avoid-the-introduction/

Artificial Intelligence, Business Intelligence, Company, Data Governance, Data Marketing, Data Mining and Data Integration, Machine Learning, Self-service Analytics

Lean UX Design: the key to revolutionizing your BI development

What is Lean UX Design and why is it crucial to your BI?

In the dynamic world of Business Intelligence (BI), where the complexity of data meets the evolving needs of users, Lean UX Design is emerging as a revolutionary approach. This user-centered methodology promises to radically transform the way we design and develop BI solutions.

Lean UX design in brief

  • User-centered approach
  • Rapid iterations and continuous feedback
  • Cross-functional collaboration
  • Waste reduction and resource optimization
  • Agile adaptation to change
But how can Lean UX concretely improve your BI projects? Let’s delve into the details.

The 5 key steps of the Lean UX process in BI

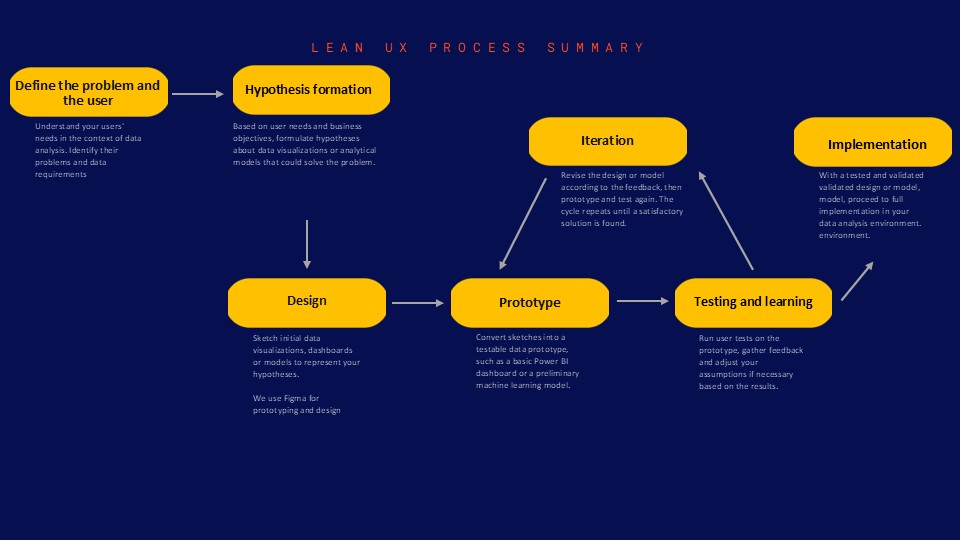
  1. Problem and user definition: gain an in-depth understanding of your BI users’ specific challenges.
  2. Ideation and hypotheses: formulate hypotheses about potential solutions.
  3. Rapid prototyping: create low-fidelity prototypes to test your ideas.
  4. User testing: get rapid feedback to validate or invalidate your hypotheses.

The tangible benefits of Lean UX in BI development

1. Significant reduction in development time and costs

By quickly identifying what works and what doesn’t, Lean UX saves precious resources.

“Thanks to DATANALYSIS’ Lean UX approach, we reduced our BI development costs by 30% while increasing user satisfaction by 50%.”

– Marie Dupont, CIO, TechInnovate SA

2. Improved user experience and adoption of BI tools

BI solutions designed with users, for users, guarantee better adoption and use.

3. Greater agility and adaptability to market changes

In an ever-changing BI environment, Lean UX enables you to pivot quickly and efficiently.

Here are the 5 steps to implementing Lean UX in your BI projects :

Integrating Lean UX into your BI strategy: where to start?

Adopting Lean UX in your BI development can seem daunting.

Here are some steps to get you started:

  1. Assess your current UX maturity
  2. Train your teams in Lean UX principles
  3. Start with a pilot project
  4. Measure and communicate results
  5. Gradually extend the approach to other projects

CONCLUSION

In a world where data is king, Lean UX offers a way to turn that data into actionable insights faster and more accurately than ever before. For companies looking to make the most of their BI investments, Lean UX isn’t just an option, it’s a competitive necessity.

At BUSINESS LAB CONSULTING, we’re passionate about applying Lean UX to BI development. Our team of experts is ready to guide you through this transformation to optimize your processes, reduce your costs and significantly improve the user experience of your BI solutions.

Want to learn more ?
Schedule a free consultation with our Lean UX experts
Artificial Intelligence, Business Intelligence, Data Governance, Data Marketing, Data Mining and Data Integration, Data Quality Management, Data Regulations, Data visualisation, Machine Learning, Self-service Analytics

DATA: 7 pitfalls to avoid, Ep 4/7 – Statistical errors – Facts are stubborn things, but statistics are malleable

“There are lies, damned lies and statistics” B.Disraeli


Why such distaste for a field that, according to Webster’s Merriam-dictionary, is simply “a branch of mathematics dealing with the collection, analysis, interpretation and presentation of masses of numerical data. ”1 Why is the field of statistics in such a negative light by so many people?

There are four main reasons

  • It’s a complex field. Even the basic concepts are not easily accessible and are very difficult to explain.
  • Even the best-intentioned experts can misapply the tools at their disposal.
  • The third reason behind all this hatred is that those with an agenda can easily create statistics to lie about when communicating with us.
  • The final reason is that statistics can often seem cold and distant, making them very difficult for the public to grasp.

Descriptive setbacks

Descriptive statistics are intended to summarize the main characteristics of a data set. However, incorrect or inappropriate use can lead to misleading conclusions. A typical example is the use of the mean to summarize a distribution, without taking into account variability or skewness. Another common error is to present percentages without explaining the total number of people, which can be misleading as to the true extent of a phenomenon. It is therefore crucial to understand the assumptions and limitations of each descriptive measure in order to use it correctly.

Let’s take the example of analyzing salaries within a company. If we simply look at average salaries, we might conclude that the company is paying its employees well. However, if management salaries are very high compared to the rest of the employees, the average would be biased upwards. It would be more relevant to use the median, which gives the salary in the middle, or to look at the complete salary distribution for a more accurate view.

This error is very well described here with cats:

Inferential fires

Always a feline explanation:

Statistical inference aims to draw conclusions about a population from a sample of that population. However, this process is subject to error. Sampling errors and Type I and II errors are common. In addition, errors can be exacerbated by confusion between correlation and causation. A solid understanding of the principles of statistical inference is essential to avoid these pitfalls.

Let’s imagine a public health study seeking to establish a link between a particular dietary habit (such as eating organic) and better overall health. If the study finds a positive correlation, it doesn’t necessarily mean that eating organic causes better health. There could be confounding factors, such as income level or lifestyle, that influence both eating habits and health status. Here, we can fall into the trap of confusing correlation with causation.

Sliding sampling

Sampling is a crucial stage in any data collection process. Yet many errors can occur at this stage. The sample may not be representative of the target population, due to selection bias or non-response. What’s more, the sample size may be insufficient to detect an effect. Careful sample planning is therefore essential to obtain reliable results.

Consider a customer satisfaction survey conducted by an e-commerce company. If the company only solicits opinions from customers who have made a recent purchase, it runs the risk of obtaining a distorted picture of overall customer satisfaction. Indeed, dissatisfied customers may have stopped making purchases and therefore not be included in the sample. This is an example of selection bias.

Insensitivity to sample size

A common mistake in data analysis is to ignore the impact of sample size on results. A large sample size can make a very small effect significant, while too small a sample size may not have sufficient power to detect an existing effect. Furthermore, statistical significance does not necessarily mean practical significance. So it’s important to consider sample size when interpreting results.

Suppose you’re conducting a study to assess the effect of a drug on lowering blood pressure. If you have a very large sample of patients, you may see a statistically significant drop in blood pressure. However, this drop may be very small, say 0.1 mm Hg, a clinically insignificant value despite its statistical significance. This is an example where sample size can make a small effect significant. On the other hand, if the sample is too small, a real effect may be missed. It is therefore important to consider clinical or practical significance in addition to statistical significance.

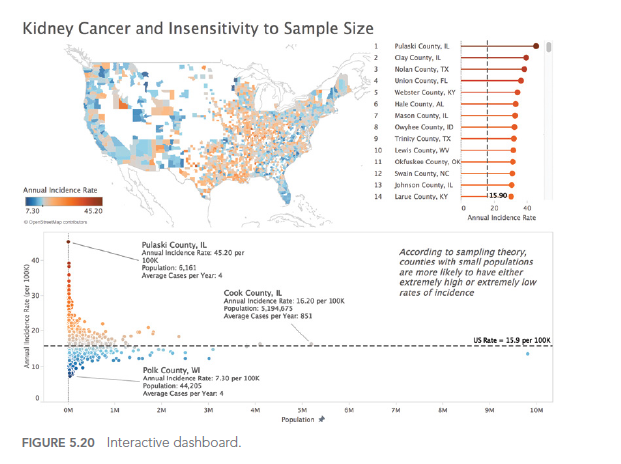
Digging deeper into this issue, Ben Jones (see author who inspired this article) managed to find figures on kidney cancer rates as well as demographics for every US county, and he created an interactive dashboard (figure below) to visually illustrate the fact that Kahneman, Wainer and Zwerlink are doing quite clearly in words.

Notice a few elements in the dashboard. On the choropleth map (filled in), the darkest orange counties (high rates relative to the overall U.S. rate) and the darkest blue counties (low rates relative to the overall U.S. rate) are often side by side.

Also, note how in the scatterplot below the map, the marks form a funnel shape, with less populated counties (on the left) more likely to deviate from the reference line (the overall U.S. rate), and more populated counties like Chicago, L.A. and New York are more likely to be close to the overall reference line.


One final observation: if you hover over a county with a small population in the interactive online version, you’ll notice that the average number of cases per year is extremely low, sometimes 4 cases or less. A small deviation – even just 1 or 2 cases – in a subsequent year will pull a county from the bottom of the list to the top, or vice versa.


In the next article, we’ll explore the 5th type of error we may encounter when using data to illuminate the world around us: Analytical aberrations.

This article is heavily inspired by the book “Avoiding Data pitfalls – How to steer clear of common blunders when working with Data and presenting Analysis and visualization” written by Ben Jones, Founder and CEO of Data Litercy, WILEY edition. We recommend this excellent read!

You can find all the topics covered in this series here: https://www.businesslab.mu/blog/artificial-intelligence/data-7-pitfalls-to-avoid-the-introduction/

Artificial Intelligence, Business Intelligence, Company, Data Governance, Data Marketing, Data Mining and Data Integration, Data Quality Management, Data Regulations, Machine Learning

DATA: 7 pitfalls to avoid. Ep 1/7 – Epistemological errors: how do we think about data?

Let’s start by defining what epistemology is.

Epistemology (from the ancient Greek ἐπιστήμη / epistémê “true knowledge, science” and λόγος / lógos “discourse”) is a field of philosophy that can refer to two fields of study: the critical study of science and of scientific knowledge (or scientific work).
In other words, it’s about how we construct our knowledge.

In the world of data, this is a central and critical topic. We are familiar with the process of transforming data into information, knowledge and wisdom:

Here, the problem lies in the way we consider our starting point: data! Indeed, the use of data and its transformation in the following stages are the result of conscious and controlled processes and procedures:

==>I clean up my data, process it in an ETL / ELT, store it, visualize it, communicate my results and share them, and so on. This mastery gives us control over the quality of each step. However, we tend to embark on this work of transforming our primary resource while overlooking a crucial point, the source of our first obstacle:

DATA IS NOT AN EXACT REPRESENTATION OF THE REAL WORLD!

Indeed, it’s all too easy to work with data by thinking of data as reality itself, and not as data collected about reality. This nuance is essential:

It’s not crime, but reported crime
It’s not the diameter of a mechanical part, but the measured diameter of that part.
It’s not public sentiment on a subject, but the declared feeling of those who responded to a survey.

Let’s go into the details of this obstacle with a few examples:

1. What we don't measure (or didn't measure)

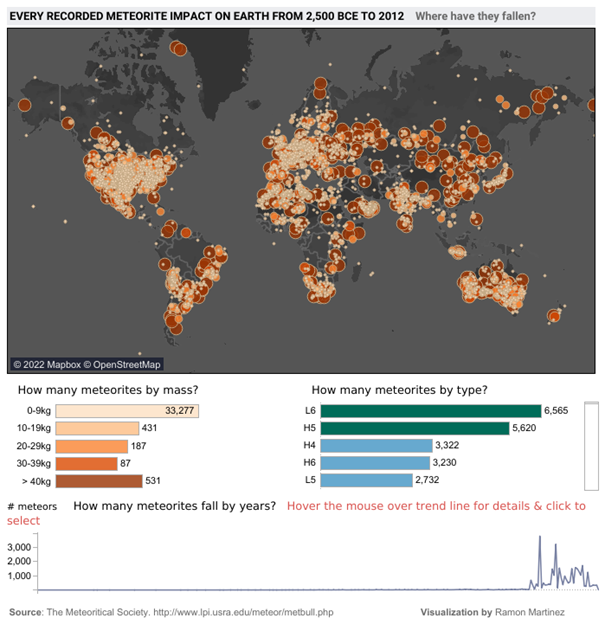
Let’s take a look at this dashboard showing all the meteorite impacts on Earth between -2500 and 2012. Can you identify what’s strange here?

Meteorites seem to have carefully avoided certain parts of the planet – a large part of South America, Africa, Russia, Greenland, etc. And if we focus on the graph showing the number of meteorites per year, these have tended to fall more in the last 50 years (and almost not over the whole period covering -2055 to 1975).

Is this really the case? Or rather flaws in the way the data was collected?

  • We have recently begun to systematically collect this information and rely on archaeology to try and determine the impacts of the past. As erosion and time have taken their toll, the traces of the vast majority of impacts have disappeared and can no longer be counted (and no, meteorites didn’t start raining in 1975).
  • For a meteorite impact to be included in a database, it has to be recorded. And to do that, you need an observation, and therefore an observer, who knows who to report it to. These two biases have a major impact on data collection, and help to explain the large areas of the Earth that seem to have been spared by the meteorite fall.

2. Measurement system not working

Sometimes, the cause of this discrepancy between data and reality can be explained by a defect in the collection equipment. Unfortunately, anything manufactured by a human being in this world is liable to fail. This applies to sensors and measuring instruments, of course.

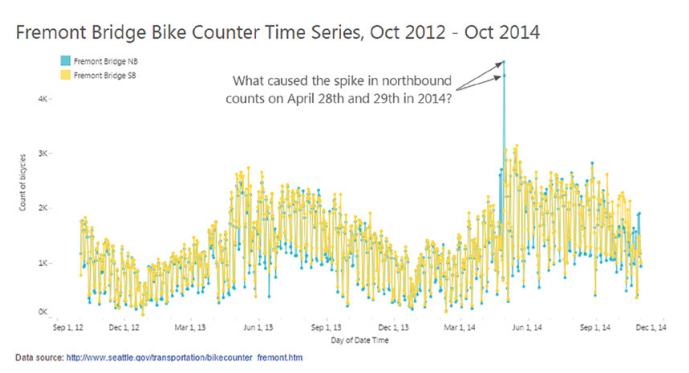
What happened on April 28 and 29, 2014 on this bridge? There seems to have been a huge spike in bicycle traffic across the Fremont Bridge, but only in one direction (blue curve).

Source : 7 datapitfalls – Ben Jones

Time series of the number of bicycles crossing the Fremont Bridge

You’d think it was a beautiful summer’s day and everyone was on the bridge at the same time? That it was a one-way bike race? That everyone who crossed the bridge on the outward journey had a flat tire on the return journey?

More prosaically, it turns out that the blue counter had a fault on those particular days and was no longer counting bridge crossings correctly. A simple change of battery and sensor solved the problem.

Now, ask yourself how many times you’ve been misled by data from a faulty sensor or measurement without being aware of it?

3. Data is too human

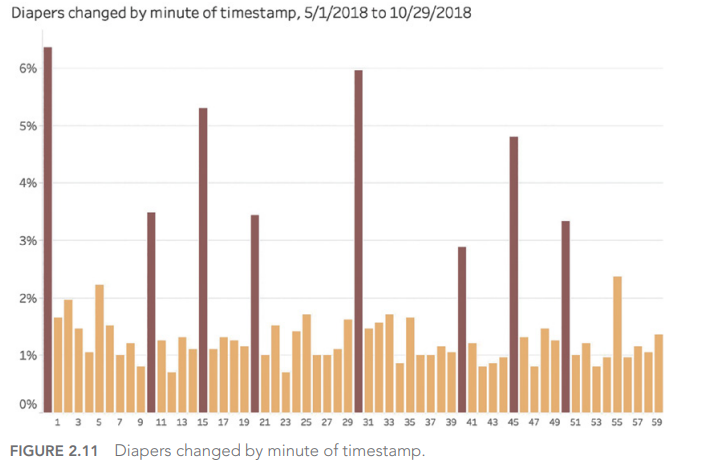
And yes, our own human biases have a major effect on the values we record when gathering information. We tend, for example, to round off measurement results:

Source : 7 datapitfalls – Ben Jones

If we go by his data, diaper changes take place more regularly every 10 minutes (0, 10, 20, 30, 40, 50) and sometimes over certain quarters of an hour (15, 45). Wouldn’t that be incredible?

It is an incredible story. In fact, we need to look at how the data was collected. As human beings, we have this tendency to round up information when we record it, especially when we look at a watch or clock: why not indicate 1:05 when it’s 1:04? Or even simpler, 1:00, because it’s even simpler?

4. The Black Swan!

The final example we’d like to highlight here is the so-called “Black Swan” effect. If we think that the data we have at our disposal is an accurate representation of the world around us, and that we can extract from it assertions to be set in stone; then we are fundamentally mistaken about what data is (see above).

The best use of data is to learn what isn’t true from a preconceived idea, and to guide us in the questions we need to ask ourselves to learn more?

But back to our black swan:

Before the discovery of Australia, every swan sighting ever made could confirm to Europeans that all swans were white – wrong! In 1697, the sighting of a black swan completely challenged this common preconception.

And the link with the data? In the same way that we tend to believe that a repeated observation is a general truth – wrongly so – we can be led to infer that what we see in the data we manipulate can be applied generally to the world around us and to any era. This is a fundamental error in the appreciation of data.

5. How to avoid epistemological error?

All it takes is a little mental gymnastics and a little curiosity:

  • Clearly understand how measurements are defined
  • Understand and represent the data collection process
  • Identify possible limitations and measurement errors in the data used
  • Identify changes in measurement methods and tools over time
  • Understand the motivations of data collectors

In the next article, we’ll explore the 2nd type of obstacle we may encounter when using data to illuminate the world around us: Technical Mistakes.

This article is heavily inspired by the book “Avoiding Data pitfalls – How to steer clear of common blunders when working with Data and presenting Analysis and visualization” written by Ben Jones, Founder and CEO of Data Litercy, WILEY edition. We recommend this excellent read!

You can find all the topics covered in this series here : https://www.businesslab.mu/blog/artificial-intelligence/data-7-pitfalls-to-avoid-the-introduction/
Artificial Intelligence, Business Intelligence, Company, Data Governance, Data Marketing, Data Mining and Data Integration, Data Quality Management, Machine Learning, Self-service Analytics, Technology

Informed decision-making: fast and effective

« Promptness in decision-making is the pillar of success, but data insight is the foundation »

This adage perfectly sums up the subject of effective and rapid decision-making, which in the majority of businesses is based on data.

In today’s business world, data has become the fuel that drives strategic decision-making. From planning day-to-day operations to developing long-term strategies, businesses are now leveraging data to guide their choices and improve their overall effectiveness.

Here’s how data-driven decisions can radically transform your business. Whether you’re a leader in your sector or expanding into a new market, you’ll inevitably have to make strategic decisions that will affect your business.

Knowing that the wrong decision can have serious consequences for your project, and even for your company, it’s essential to have the right processes, decision-making tools and, above all, data.

Accuracy and relevance

Data-driven decisions are based on tangible, factual information, eliminating guesswork and hunches that are often prone to error. By using accurate, up-to-date data, businesses can make more informed and relevant decisions, reducing the risk of costly errors.

Identifying trends

By analysing large data sets, businesses can identify significant trends and recurring patterns. This enables them to anticipate market changes, identify new opportunities and stay ahead of the competition.

Personalising customer experiences

Customer behaviour data enables businesses to create personalised, tailored experiences. By understanding individual customer needs and preferences, businesses can offer better-tailored products and services, boosting customer loyalty and satisfaction.

Using technology to accelerate & optimise the process

Operational data enables companies to optimise their internal processes. By identifying inefficiencies and bottlenecks, companies can make precise adjustments to improve productivity, reduce costs and increase overall operational efficiency.

Data processing technologies such as artificial intelligence (AI), machine learning and predictive analytics can accelerate the decision-making process by automating repetitive tasks and providing actionable insights in real time. Advanced algorithms can detect subtle patterns in data, helping decision-makers to make better and faster decisions.

Data-driven decisions: the key to agility & agile decision-making

With real-time access to data, businesses can make decisions faster and more agilely. Using real-time dashboards and analysis, decision-makers have the information they need to react quickly to market changes and new opportunities.

Informed decision-making depends on access to accurate, up-to-date data. Companies that invest in data collection, analysis and visualisation systems are better equipped to make rapid, informed decisions. By exploiting available data, they can quickly assess market trends, understand customer needs and identify opportunities for growth.

Speed without compromising quality

While speed is essential in a competitive business environment, this does not mean sacrificing the quality of decisions. Data provides an objective framework on which to base choices, reducing the risk of costly errors associated with impulsive or ill-informed decision-making. By combining speed and accuracy, businesses can make effective decisions while maintaining a high level of quality and relevance.

The importance of a data culture

Beyond tools and technologies, informed decision-making depends on an organisational culture that values data and fosters collaboration. Companies that foster a data culture are better equipped to collect, analyse and effectively use information to make decisions. By encouraging transparency, communication and collaboration, these companies can fully exploit the potential of data to drive innovation and growth.

Conclusion

By adopting a data-driven approach, businesses can transform the way they make decisions, moving from an approach based on intuition to one based on tangible, verifiable data. As a result, they can improve operational efficiency, drive growth and maintain competitiveness in the ever-changing marketplace. Ultimately, businesses that fully embrace data-driven decision-making are better positioned to thrive in the modern economy.

Informed, data-driven decision-making offers an undeniable competitive advantage in the modern business environment. By combining speed and efficiency with the accuracy of data, businesses can adapt quickly to market changes, seize opportunities and maintain their position as leaders in their sector. By investing in advanced data processing technologies and fostering a data-driven culture within the organisation, businesses can successfully navigate an ever-changing world and thrive in the face of uncertainty.

Did this article inspire you ?
Artificial Intelligence, Business Intelligence, Change and Project Management, Data Governance, Data Marketing, Data Mining and Data Integration, Machine Learning, Self-service Analytics, Technology

Mastering your Data: the essence and impact of the data catalogue

In today’s hyper-connected world, where data is seen as the new gold, knowing how to manage and exploit it is essential for businesses wishing to make informed decisions and remain competitive. The concept of the data catalogue is emerging as a key response to this challenge, offering a compass in the vast and often tumultuous ocean of data.

This article aims to shed light on the challenges and benefits of data catalogues, modern libraries where metadata is not just stored, but made comprehensible and accessible. Through the automation of metadata documentation and the implementation of collaborative data governance, data catalogues are transforming the way organisations access, understand and use their valuable information.


By facilitating the discovery and sharing of trusted data, they enable organisations to navigate confidently towards a truly data-driven strategy.

But also...

A data catalogue is a centralised tool designed to effectively manage data within an organisation. According to Gartner, it maintains an inventory of active data by facilitating its discovery, description and organisation.

The basic analogy would be to say that it is a directory, where readers find the information they need about books and where they are: title, author, summary, edition and the opinions of other readers.

The aim of a data catalogue is to make data governance collaborative, by improving accessibility, accuracy and relevance of data for the business. It supports data confidentiality and regulatory compliance through intelligent data lineage tracing and compliance monitoring.

Here are 5 reasons for your data teams to use a data catalogue:

Data analysts / Business analysts

They use the data catalogue to find and understand the data they need for their analyses. This enables them to access relevant data quickly, understand its context and guarantee its quality and reliability for reporting and analysis.


Data Scientists

The data catalogue is essential for locating the datasets they need for their machine learning and artificial intelligence models. It also makes it easier to understand the metadata (where the data comes from and the transformations it has undergone), which is vital for data pre-processing.


Data Stewards

They are responsible for data quality, availability and governance. They use the data catalogue to document metadata, manage data standards, and monitor compliance and the use of data within the organisation.


Compliance and security managers

The data catalogue helps them to ensure that data is managed and used in accordance with current regulations, such as the GDPR for the protection of personal data. They can use it to track access to sensitive data and audit data use.


Data architects and engineers

These technicians use the data catalogue to design and maintain the data infrastructure. It provides them with an overview of the data available, its structure and its interrelationships, making it easier to optimise the data architecture and integrate new data sources.

It’s important to note that business users are not left out of this tool either. Although they are not technical users, they benefit from the data catalogue to access the information and insights they need to make decisions. The directory enables them to find relevant data easily, without the need for in-depth technical knowledge.

Key points

A data catalogue is used to:


  • Improve data discovery and access


  • Strengthen data governance


  • Improve data quality and reliability


  • Facilitate collaboration between teams


  • Optimise the use of data resources


With Data Catalogues, just as we now do with our own revolutionary DUKE solution, navigate the complex data landscape today, with the luxury of effectively accessing, managing and exploiting data to support informed decision-making and business innovation.

Let your Data teams shine today and dive straight into the heart of our DUKE project.

Artificial Intelligence, Hospitality

Innovation- Chatbots in the Hospitality Industry

Chatbots were one of the most significant trends of 2017. These small pieces of software with pre-programmed interactions allow you to communicate with them naturally and simulate the behavior of a human being within a conversational environment. It can be a standalone service or integrate within other messaging platforms like Facebook Messenger.
The adoption of these virtual assistants is growing, and brands are using chatbots in lots of exciting ways. You can order food, schedule flights and get recommendations for pretty much anything. Chatbots seemingly are the future of marketing and customer support.
The use of chatbots in the hotel industry is still evolving, but it currently encompasses a wide range of services, from hotel bookings and customer service inquiries to pre/post-stay inquiries and general travel advice.
The hotel industry can experience many benefits from the use of chatbots, among them:
  • They can be used as a reservation channel to increase direct bookings.
  • Since chatbots are available 24/7, they will reduce reception workload by giving guests instant and helpful answers around the clock.
  • Guests can check-in/check-out on the fly with the aid of a chatbot.
  • They will help independent hotels to build accurate guest profiling so that they can provide personalized offers to their guests. The hotel will be able to deliver tailor-made offers instantly and directly via chat before, during or after their stay.
  • Guests can opt-in to be notified from chatbots about the places to visit, the rates of the hotel’s cars, etc.
  • The ease of booking and the proactive concierge services create brand loyalty and improve guest satisfaction.
  • Hoteliers will be able to obtain customer reviews post-stay via a chatbot. This is much less invasive compared to traditional email marketing, which is often ignored.
What challenges do they pose for hoteliers?
Adopting this new hotel technology involves many challenges for hoteliers. For instance:
  • Independent hotels will need to simplify their booking process to accommodate chatbots.
  • Hoteliers will need to provide a consistent booking experience on chatbots in comparison to other channels.
  • General managers will need to monitor chatbots where there is a human element. They will need to allocate staff resources.
  • Hoteliers will need to manage guest expectations since guests will expect a quick turnaround on their requests through chatbots.
As you can see, chatbots present many opportunities for hoteliers, from increasing customer loyalty to enhancing the guest experience. To keep your guests coming back for more, definitely consider joining the chatbot revolution – but only if your hotel is equipped and prepared for this big step.