Author: a.laguarigue

Self-service Analytics

My World 2030 – Harness data to drive sustainability and corporate responsibility

Over the past couple of months if not years we have seen headline grabbing scandals in various sectors of the economy worldwide.  The public trust is being hugely impacted with regards to the competence of executive leadership, integrity and transparency.

Earning trust requires the utmost attention to demonstrating ethical leadership, responsible (and responsive) business practices, transparency, and a genuine commitment to an organisation’s mission.

Companies are being encouraged to put their increased profit into programs that give back to society in terms of environmental, social, and governance (ESG) aspects More than ever before, there’s growing expectations that organisations will continue to play a very active role in solving social problems such as poverty or discrimination. It’s important that organisations set standards of ethical behaviour for its peers, competition and industry.

So how can data drive sustainability and corporate responsibility? The writing is on the wall!  With the rapidly evolving technology and high velocity and volume of data flooding organisations, it becomes imperative to provide users with an ultimate analytics experience, one with zero discernible latency when interacting with data. By giving users the right tools, they will explore avenues to use data to solve real world problems.

As data becomes more available and analytic literacy more pervasive, it is crucial that companies continue to focus on how their business operations are impacting the value chain, from the farm to the factory to the boardroom.

With the advent of sensors and devices in mobile objects, companies can now leverage spatial data for powerful geospatial analysis for environmental risk assessments. The better the data sets available to assess these risks, the more informed the decisions about adaptation are likely to be.

Energy and Resources give modern society its high standard of living and produce vast quantities of data, from the energy used to the resources needed to make many of these things that help us in business and our everyday lives.

Without a deep understanding that energy is finite and that energy transformations impact not just individuals but also the environment., companies and society at large won’t be able to make informed decisions about the future. With an efficient platform for gaining insights across geographies, products, services, and sectors, companies can maximize downstream profits and minimize upstream costs.

It is the era of data-driven environmental policy-making. Governments can now harness data to effective policy making. Data analytics and visualisation give the opportunity to make the invisible visible, the intangible tangible, and the complex manageable. A data driven government calls for strong leadership and investment. This is highly feasible.  A data driven government would make it easier to identify problems, track trends, highlight policy successes and failures, identify best practices, and optimize the gains from investments in environmental protection. A responsive government would work in close collaboration with businesses, NGOs and the academic community for more conscientious environmental decision-making.

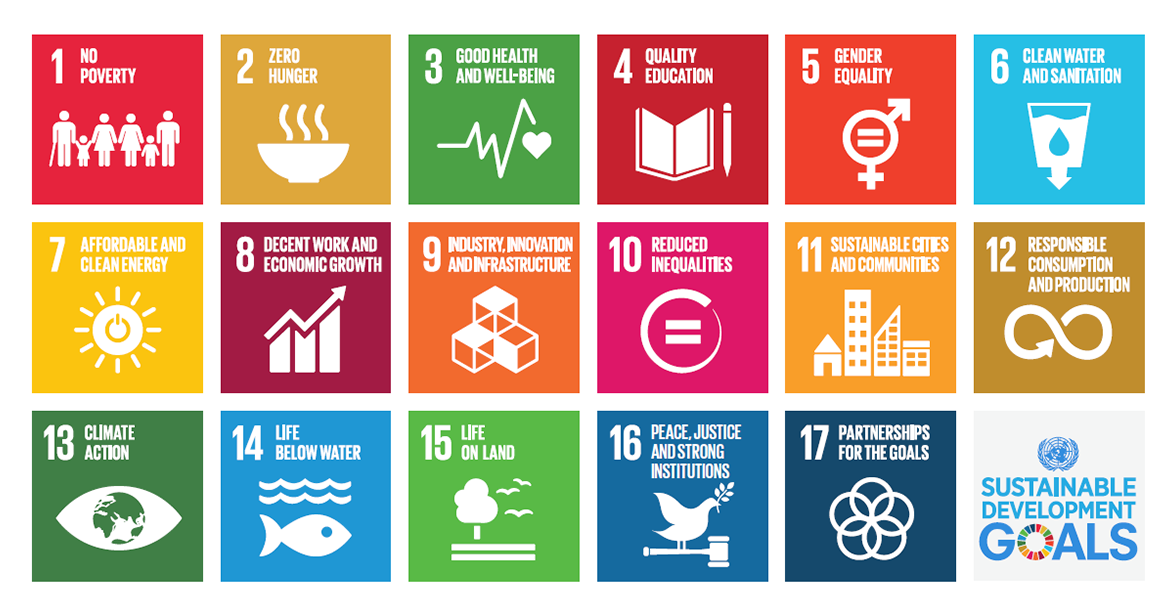
Data alone will not help us achieve the UN SDGs. What we need is strong leadership both from businesses and governments, transparency , integrity and a genuine commitment to the UN 17 SDGs. These combined with modern data analytics will provide collaborative, multilateral solutions to global challenges.

This is My World 2030!!

Self-service Analytics

Track profit, loss with an intuitive CFO dashboard

This CFO dashboard combines complex profit-and-loss data into one page that’s anything but. The top two views provide an overall picture of quarterly and yearly performance over the past three years. The views include key financial measures such as net sales, net profit, and net profit margin. Whether you want to view your numbers according to region, channel, customer segment, or product category, the results are right at your fingertips.

Click on the link below and be amazed by this dashboard . It’s just a click  away!!

https://www.tableau.com/solutions/workbook/cfos-overview-business


Happy to have a chat with you to share ideas, discuss opportunities or even prepare a demo for you . Contact us on info@businesslab.mu.

Data Governance, Data Regulations

GDPR and Data Governance: A hand in hand affair

The introduction of GDPR should not be seen as a burden for companies but rather as an opportunity to review all the data governance policies that are in place. Companies should be able to find the right balance between GDPR and their data governance structure.

Companies could create a competitive edge by not only addressing how they manage the personal data but for all the data they hold. If companies get it right, they could discover new business opportunities waiting to be exploited.

As we all know by now, the GDPR gives every EU citizen the right to know and decide how their personal data is being used, stored, protected, transferred and deleted.

Those companies that put data privacy at the forefront of their business strategy would be the ones who are clearly and efficiently managing their customer data in a fair and transparent way. Hence giving them the competitive edge based on privacy.

One of the requirements of GDPR is to document what personal data is held, where it came from and who is it shared with. By really understanding the data they hold, companies could be made aware of the data they can gather, as well as analyse and apply this data to boost sales or marketing efforts.

Companies should ensure that their data governance structure will support the GDPR requirements. Policies and procedures need to be created or re-assessed to help keep corporate data consistent and ensure that it meets the information needs of business users. It is also an opportunity to review data management practices.

The GDPR requirements combined with a robust data governance structure could give organisations the opportunity to become a data-driven company based on building tools, abilities, and a culture that acts on data hence really making an internal transformation around data.

Self-service Analytics

4 ways visual analytics can be additive to improve financial analysis

What if financial professionals had a faster way to complete all of their reporting and scale ad-hoc question and answer cycles? What if the finance department could improve the communication of insights to the entire enterprise—even within existing tech stacks, and large disparate databases?

Modern financial departments are adding self-service, visual analytics to their existing processes to deliver richer and more actionable insights to the business faster.

4 ways visual analytics can be additive to improve financial analysis and save significant time across many use cases and finance teams:

  1. Unify and use all of your data
  2. Scale and repeat analysis faster
  3. Interactive, ad-hoc analytics reveal data outliers
  4. Improve organisational communication if insights


1.Unify and use all of your data

Regardless of the size of your organization, there’s financial data everywhere—and a lot of it. Whether you want to analyze live enterprise resource planning (ERP) data living in a warehouse, or transactional data living in the cloud, or still dump HR and CRM data into different spreadsheets, you can combine any and all of it within a single, visual analytics platform, and blend it on a common field to see more accurate, holistic views of your data.

Once you have your data connected and unified with a visual analytics platform, not only will you be able to select specific data sets on-the-fly, and choose which metrics to work with, you’ll spend way more time doing deeper analysis in a visual setting.


2.Scale and repeat analysis faster

Whether you’ve been filling your spreadsheets to the breaking point, working with smaller data sets, or running sophisticated macros and calculations in spreadsheets, you’re often left waiting and miserable. You just need to iterate your existing analysis more quickly— you need to be able to ask and answer your data questions without having to start over every time. Once you’ve

unified your data, you’re ready to take your analysis to the next level with visual analytics.


3.Interactive, ad-hoc analytics reveal data outliers

Visual analytics are not chart wizards—they’re interactive, can connect to live data sources, and offer an ever-changing analysis of what’s happening now, not last week or last month. Visual analytics can take static reports and turn them into automated and interactive dashboards that anyone can access for the most accurate insights at any time. Everyone in the finance department will spend less time dealing with broken formulas, human error, and more time interacting with data in a dynamic way to explore and reveal critical insights coming from data outliers.


4.Improve organisational communication of insights

With visual and interactive dashboards, collaboration is built in as an integral step in the organization’s cycle of analytics. There are no additional configurations or add-ons required to share or collaborate with data, and because users can ask and answer their own questions directly in the dashboard, there are fewer redundant emails and requests to run more numbers. Finance users can simply publish and share dashboards online, to a server, or directly with the people with whom they want to collaborate, and they can immediately see how often reports are being viewed and used. And with live data connections, reports aren’t instantly out of date.


Source:Tableau Software

Business Intelligence

Key Benefits Of Tableau Software In The Retail Sector


Tableau helps people see and understand their retail data no matter how big it is, or how many systems it is stored in. Quickly connect, analyze, and share insights to reveal hidden opportunities that impact each sale, and your entire organization. With a seamless experience across PC, tablet, and smartphone, ask and answer deeper operational questions with expressive, interactive dashboards—no programming skills required.


Key Benefits of Tableau in the Retail Sector:

Product Availability

Tableau can help retailers  to solve the problem of having the correct product, at correct inventory levels, in the correct stories. By analyzing product availability by category, supplier, day, and store region, retailers can identify gaps in efficiency and interactively drill into the details.

Promotional Optimization

More than half of all retail sales are made during promotions, so it’s important to be able to visualize data during each phase – pre-promotion, the promotional period itself, and post-promotion. Tableau helps you create dashboards showing  exactly what’s happening throughout the promotional cycle so they can prepare for availability issues by highlighting potential inventory stock shortages.

Store Operations

Store operations dashboards can provide rich insights to the corporate office, and region/ store managers about performance and execution. With store operations dashboards, managers are able to better benchmark the performance of stores in a region against metrics like Sales, Year Over Year growth, Traffic, Average Transaction Value and Units Per Transaction. They can also drill down to unique store level operations data like weekday vs weekend sales, product department performance, compare space productivity within the store and evaluate top selling brands.

Merchandising Assortment

Category managers need to make profitable decisions around products that customers are demanding. In order to do that, merchandisers need to quickly analyze demand data by sales and profit margin performance by departments, sub-categories and brands. With merchandising assortment dashboards, managers can gain a quick overview of relative sales performance of sub-categories, share of private label and national brands, and categories that can contribute up to 80% of sales. They can also get richer insights on the attributes that lead to higher conversion such as product type, colors, shape, and styles.

Brand Health

For most consumer product goods companies, brand perception is critical to the success of their business. Executives at large CPG companies need insights into how consumers perceive the company brand, for the benefit of derived utility and price.

A brand health dashboard can show the benefit vs price effect by deep diving at the sub brand level . Combining this with profitability and price elasticity of the brand, executives can decide on allocation of additional marketing dollars to gain Category leadership for these brands and push the benefit perception higher for higher profitability brands.

Happy to have a chat with you to share ideas, discuss opportunities or even prepare a demo for you . Contact us on info@businesslab.mu.

Data Regulations

20 Fun Facts about GDPR ?

  1. GDPR is short for General Data Protection Regulation.
  2. GDPR are rules for the protection of personal data inside and outside the EU.
  3. The aim of GDPR is to give residents control over their personal data and unify the regulations within the whole Union.
  4. GDPR went into effect on May 25 ,2018.
  5. Seven key guiding principles to process personal data.
  6. GDPR covers aspects of data security, rights and freedoms of EU data subjects, regulatory compliance and risks, data governance and control of data.
  7. GDPR is enforced by the supervisory authority in each member state.
  8. GDPR affects any and every organization across the world that does business with people in EU member states.
  9. It makes organizations directly accountable for what they do and don’t do with sensitive EU citizen data. This also includes governments agencies and other public associations.
  10. There are a lot of processes and procedures to document!!
  11. Technology plays a very important role.
  12. GDPR allows for a 360 degree view of data subjects and a single source of truth.
  13. Certain organisations that process data may be required to appoint a Data Privacy Officer.
  14. The GDPR imposes a set of serious penalties on data controllers and processors for non-compliance.
  15. The GDPR maximum penalty is 4% of global annual turnover or €20 million – whichever is higher.
  16. A written warning can be sent to organisations in cases of first and non-intentional non-compliance.
  17. Fines under GDPR of up to 10€ million or 2% of annual worldwide turnover will be imposed on organisations that don’t uphold the obligations of data controllers.
  18. If an organisation incurs a data breach, they should notify the relevant authorities within 72 hours.
  19. Implementing the GDPR is not an option, but a legal requirement, which needs a high degree of commitment and resources.
  20. GDPR can offer numerous opportunities with a well-designed internal data protection framework.
Data Governance

How does your data appetite look like ?

Digital capabilities are changing fast, making it hard to know whether you are ahead of the curve or falling behind. A digital transformation isn’t complete unless a business adopts big data.

Are you already on the bandwagon or are you not sure where to start? If you can answer the following questions then you are on a roll!! If not there’s still time to make a difference.

1)     Are you overwhelmed by the data that is flooding in at great speed and in high volumes?

2)     How much is your data worth?

3)     Do you know how data was created in the past and how it is created now in your organisation?

4)     Do you use data to create strategic opportunities?

5)     Are your analytics aligned with the overall organization’s strategy?

6)     Is your IT dept ready to support the rapid development and implementation of new digital marketing capabilities?

7)     Who carries the bat for digital transformation in your organisation?

8)     Can you analyse big data quickly and make fact-based decisions?

9)     Are you capturing, sharing and managing corporate data assets?

10)  Can you learn more than has ever been possible about what your customers want?