My World 2030 – Harness data to drive sustainability and corporate responsibility
Over the past couple of months if not years we have seen headline grabbing scandals in various sectors of the economy worldwide. The public trust is being hugely impacted with regards to the competence of executive leadership, integrity and transparency.
Earning trust requires the utmost attention to demonstrating ethical leadership, responsible (and responsive) business practices, transparency, and a genuine commitment to an organisation’s mission.
Companies are being encouraged to put their increased profit into programs that give back to society in terms of environmental, social, and governance (ESG) aspects More than ever before, there’s growing expectations that organisations will continue to play a very active role in solving social problems such as poverty or discrimination. It’s important that organisations set standards of ethical behaviour for its peers, competition and industry.
So how can data drive sustainability and corporate responsibility? The writing is on the wall! With the rapidly evolving technology and high velocity and volume of data flooding organisations, it becomes imperative to provide users with an ultimate analytics experience, one with zero discernible latency when interacting with data. By giving users the right tools, they will explore avenues to use data to solve real world problems.
As data becomes more available and analytic literacy more pervasive, it is crucial that companies continue to focus on how their business operations are impacting the value chain, from the farm to the factory to the boardroom.
With the advent of sensors and devices in mobile objects, companies can now leverage spatial data for powerful geospatial analysis for environmental risk assessments. The better the data sets available to assess these risks, the more informed the decisions about adaptation are likely to be.
Energy and Resources give modern society its high standard of living and produce vast quantities of data, from the energy used to the resources needed to make many of these things that help us in business and our everyday lives.
Without a deep understanding that energy is finite and that energy transformations impact not just individuals but also the environment., companies and society at large won’t be able to make informed decisions about the future. With an efficient platform for gaining insights across geographies, products, services, and sectors, companies can maximize downstream profits and minimize upstream costs.
It is the era of data-driven environmental policy-making. Governments can now harness data to effective policy making. Data analytics and visualisation give the opportunity to make the invisible visible, the intangible tangible, and the complex manageable. A data driven government calls for strong leadership and investment. This is highly feasible. A data driven government would make it easier to identify problems, track trends, highlight policy successes and failures, identify best practices, and optimize the gains from investments in environmental protection. A responsive government would work in close collaboration with businesses, NGOs and the academic community for more conscientious environmental decision-making.
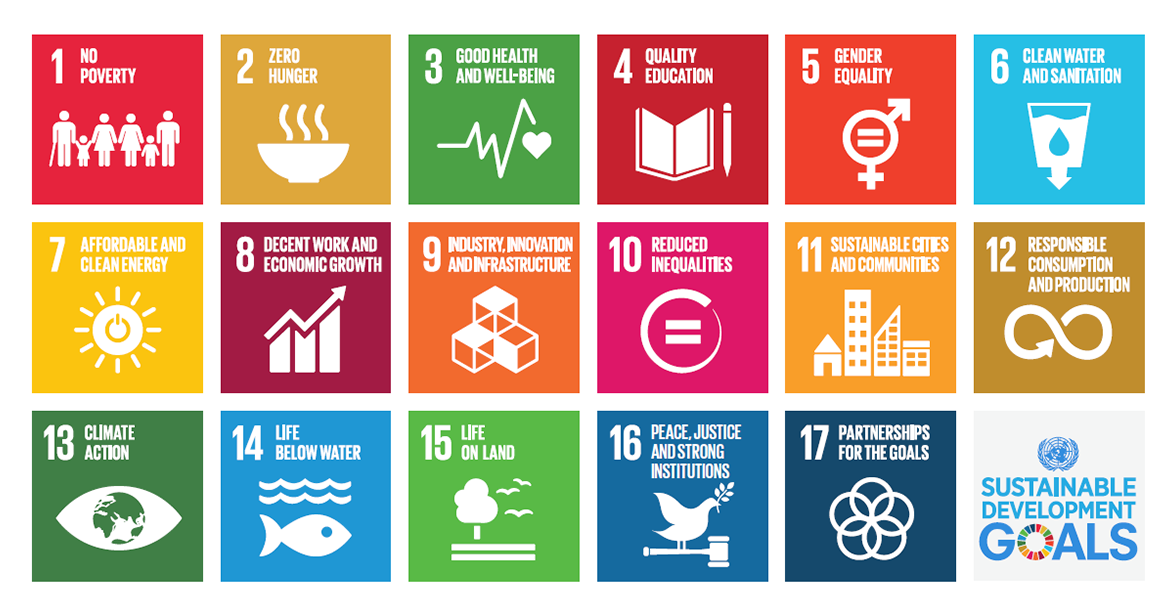
Data alone will not help us achieve the UN SDGs. What we need is strong leadership both from businesses and governments, transparency , integrity and a genuine commitment to the UN 17 SDGs. These combined with modern data analytics will provide collaborative, multilateral solutions to global challenges.
This is My World 2030!!


