Self-service Analytics

Self-service Analytics

Manage your Hospitality using Tableau Software

Data and analytics are playing an increasingly critical role in hotel and leisure operators’ understanding of their customers’ behaviour, so that swift actions can be taken to really satisfy their needs and wants.

At the same time, hotel operators have multiple datasets lying in various locations – customer profiles, customer feedback, occupancy rates, F&B sales etc. – creating data silos, from which the fullest potential cannot be tapped until they are integrated to gain a single version of truth.

Your teams could use Tableau to develop weekly and monthly reports that they could share with the entire company. The reports could feature sales figures and updates from top management and country managers, marketing and financial data, along with other growth updates. The comprehensive dashboards make sharing complex information with the rest of the company a much easier task.

With weekly reporting that details KPIs and shows how booking patterns are changing, details on revenue, commission and conversion rates but to name a few, allows you to extract the best insights for the team.

Tableau helps you stay competitive by making the time to develop and deliver insightful analysis and reports significantly shorter.

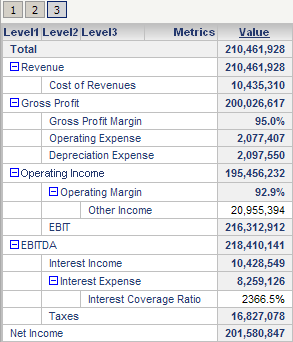
A business, which is highly metric-driven, is optimized with Tableau’s rapid-fire data analytics and drag-and-drop functions as period-on-period metric can be compared.

Tableau is a powerful tool because of its cross-platform adaptability. Tableau’s beautiful dashboards can be mobile-optimized, which makes it easy for everyone to access the findings even on the go. Tableau basically has the power to give you any insights you are looking for from the data that you can get your hands on.

Tableau can be a huge game-changer. So instead of having to wait for something to already happen and then try to figure out why it happened, you can now proactively look out and see what’s going to happen before it happens and then prepare for that or maybe change it.


Self-service Analytics

My World 2030 – Harness data to drive sustainability and corporate responsibility

Over the past couple of months if not years we have seen headline grabbing scandals in various sectors of the economy worldwide.  The public trust is being hugely impacted with regards to the competence of executive leadership, integrity and transparency.

Earning trust requires the utmost attention to demonstrating ethical leadership, responsible (and responsive) business practices, transparency, and a genuine commitment to an organisation’s mission.

Companies are being encouraged to put their increased profit into programs that give back to society in terms of environmental, social, and governance (ESG) aspects More than ever before, there’s growing expectations that organisations will continue to play a very active role in solving social problems such as poverty or discrimination. It’s important that organisations set standards of ethical behaviour for its peers, competition and industry.

So how can data drive sustainability and corporate responsibility? The writing is on the wall!  With the rapidly evolving technology and high velocity and volume of data flooding organisations, it becomes imperative to provide users with an ultimate analytics experience, one with zero discernible latency when interacting with data. By giving users the right tools, they will explore avenues to use data to solve real world problems.

As data becomes more available and analytic literacy more pervasive, it is crucial that companies continue to focus on how their business operations are impacting the value chain, from the farm to the factory to the boardroom.

With the advent of sensors and devices in mobile objects, companies can now leverage spatial data for powerful geospatial analysis for environmental risk assessments. The better the data sets available to assess these risks, the more informed the decisions about adaptation are likely to be.

Energy and Resources give modern society its high standard of living and produce vast quantities of data, from the energy used to the resources needed to make many of these things that help us in business and our everyday lives.

Without a deep understanding that energy is finite and that energy transformations impact not just individuals but also the environment., companies and society at large won’t be able to make informed decisions about the future. With an efficient platform for gaining insights across geographies, products, services, and sectors, companies can maximize downstream profits and minimize upstream costs.

It is the era of data-driven environmental policy-making. Governments can now harness data to effective policy making. Data analytics and visualisation give the opportunity to make the invisible visible, the intangible tangible, and the complex manageable. A data driven government calls for strong leadership and investment. This is highly feasible.  A data driven government would make it easier to identify problems, track trends, highlight policy successes and failures, identify best practices, and optimize the gains from investments in environmental protection. A responsive government would work in close collaboration with businesses, NGOs and the academic community for more conscientious environmental decision-making.

Data alone will not help us achieve the UN SDGs. What we need is strong leadership both from businesses and governments, transparency , integrity and a genuine commitment to the UN 17 SDGs. These combined with modern data analytics will provide collaborative, multilateral solutions to global challenges.

This is My World 2030!!

Self-service Analytics

Track profit, loss with an intuitive CFO dashboard

This CFO dashboard combines complex profit-and-loss data into one page that’s anything but. The top two views provide an overall picture of quarterly and yearly performance over the past three years. The views include key financial measures such as net sales, net profit, and net profit margin. Whether you want to view your numbers according to region, channel, customer segment, or product category, the results are right at your fingertips.

Click on the link below and be amazed by this dashboard . It’s just a click  away!!

https://www.tableau.com/solutions/workbook/cfos-overview-business


Happy to have a chat with you to share ideas, discuss opportunities or even prepare a demo for you . Contact us on info@businesslab.mu.

Self-service Analytics

4 ways visual analytics can be additive to improve financial analysis

What if financial professionals had a faster way to complete all of their reporting and scale ad-hoc question and answer cycles? What if the finance department could improve the communication of insights to the entire enterprise—even within existing tech stacks, and large disparate databases?

Modern financial departments are adding self-service, visual analytics to their existing processes to deliver richer and more actionable insights to the business faster.

4 ways visual analytics can be additive to improve financial analysis and save significant time across many use cases and finance teams:

  1. Unify and use all of your data
  2. Scale and repeat analysis faster
  3. Interactive, ad-hoc analytics reveal data outliers
  4. Improve organisational communication if insights


1.Unify and use all of your data

Regardless of the size of your organization, there’s financial data everywhere—and a lot of it. Whether you want to analyze live enterprise resource planning (ERP) data living in a warehouse, or transactional data living in the cloud, or still dump HR and CRM data into different spreadsheets, you can combine any and all of it within a single, visual analytics platform, and blend it on a common field to see more accurate, holistic views of your data.

Once you have your data connected and unified with a visual analytics platform, not only will you be able to select specific data sets on-the-fly, and choose which metrics to work with, you’ll spend way more time doing deeper analysis in a visual setting.


2.Scale and repeat analysis faster

Whether you’ve been filling your spreadsheets to the breaking point, working with smaller data sets, or running sophisticated macros and calculations in spreadsheets, you’re often left waiting and miserable. You just need to iterate your existing analysis more quickly— you need to be able to ask and answer your data questions without having to start over every time. Once you’ve

unified your data, you’re ready to take your analysis to the next level with visual analytics.


3.Interactive, ad-hoc analytics reveal data outliers

Visual analytics are not chart wizards—they’re interactive, can connect to live data sources, and offer an ever-changing analysis of what’s happening now, not last week or last month. Visual analytics can take static reports and turn them into automated and interactive dashboards that anyone can access for the most accurate insights at any time. Everyone in the finance department will spend less time dealing with broken formulas, human error, and more time interacting with data in a dynamic way to explore and reveal critical insights coming from data outliers.


4.Improve organisational communication of insights

With visual and interactive dashboards, collaboration is built in as an integral step in the organization’s cycle of analytics. There are no additional configurations or add-ons required to share or collaborate with data, and because users can ask and answer their own questions directly in the dashboard, there are fewer redundant emails and requests to run more numbers. Finance users can simply publish and share dashboards online, to a server, or directly with the people with whom they want to collaborate, and they can immediately see how often reports are being viewed and used. And with live data connections, reports aren’t instantly out of date.


Source:Tableau Software

Self-service Analytics

Leveraging data to grow your business

As an HR leader, you need an overview of the different aspects of your company’s biggest asset: your employees. Having an authentic view of the state of your workplace specificities and needs, your workforce planning, is not an easy task.

HR data are disseminated across various systems; Business Lab helps you combine them all and visualize the impact of retention initiatives on employee productivity, or their overall satisfaction. Measure your workforce value with modern HR analytics and drive business performance with interactive dashboards.

Gather and manage all this data in one place while allowing other people to work on it and keep a unique version of the truth in any case.

We are always happy to talk with potential and existing customers! Please get in touch if you desire more information about our company or products and services.